A simple way to detect market bullish OR bearish.
sum stocks on RSI 60 zone and sum stocks on RSI 40 zone.
if bullish , bullRSI line will go up, bearRSI line will go down.
if bearih , bearRSI line will go up, bullRSI line will go down.


Results 1 to 5 of 5
A simple way to detect market bullish OR bearish.
sum stocks on RSI 60 zone and sum stocks on RSI 40 zone.
if bullish , bullRSI line will go up, bearRSI line will go down.
if bearih , bearRSI line will go up, bullRSI line will go down.
bullbearRSI ( AFL compare RSI ) downloaded for more than 1900 times

even simpler, tsunamizawa..
if bullish, price goes up, if bearish price goes down. no need for calculations
please attach your chart.
you need a chart to understand if price is going up its bullish and opposite bearish?
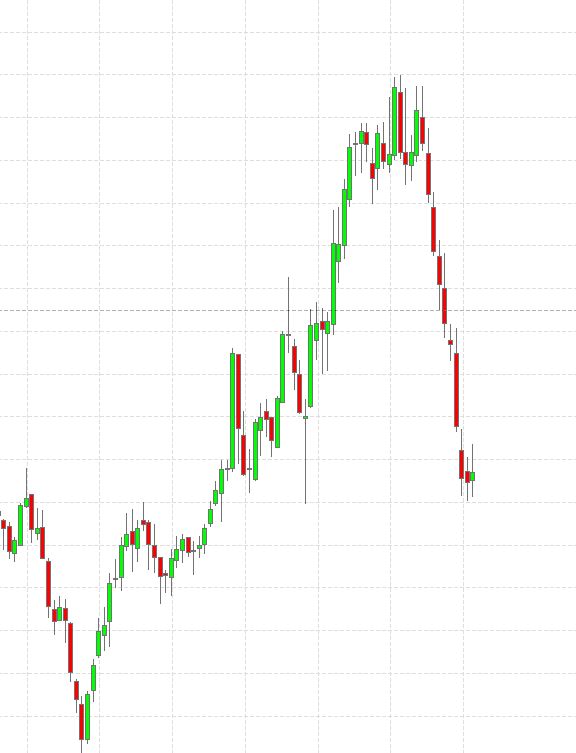
does this help..green =up, red = down
price going up bullish, price going down, bearish
no need for bullbearRSI Attached Thumbnails